 Psst! Do you accept cookies?
:::info This paper is available on arxiv under CC BY-SA 4.0 DEED license.
Authors:
(1) Lana L. Blaschke, Earth System Modelling, School of Engineering and Design, Technical University of Munich, Munich, Germany, Potsdam Institute for Climate Impact Research, Potsdam, Germany and [email protected];
(2) Da Nian, Potsdam Institute for Climate Impact Research, Potsdam, Germany;
(3) Sebastian Bathiany, Earth System Modelling, School of Engineering and Design, Technical University of Munich, Munich, Germany, and Potsdam Institute for Climate Impact Research, Potsdam, Germany;
(4) Maya Ben-Yami, Earth System Modelling, School of Engineering and Design, Technical University of Munich, Munich, Germany, and Potsdam Institute for Climate Impact Research, Potsdam, Germany;
(5) Taylor Smith, Institute of Geosciences, University of Potsdam, 14476 Potsdam, Germany;
(6) Chris A. Boulton, Global Systems Institute, University of Exeter, EX4 4QE Exeter, UK ;
(7) Niklas Boers, Earth System Modelling, School of Engineering and Design, Technical University of Munich, Munich, Germany, Potsdam Institute for Climate Impact Research, Potsdam, Germany, Global Systems Institute, University of Exeter, EX4 4QE Exeter, UK, and Department of Mathematics, University of Exeter, EX4 4QF Exeter, UK.
:::
Table of Links
- Abstract and Introduction
- Materials and Methods
- Data
- Results
- Conclusions, Open Research Section and Conflict of Interest/Competing Interests
- Author Contributions, Supplementary Information, Acknowledgments and References
- Additional Insight from the Conceptual Model
- AMSR2 until 2022 Excluded Due to Missing Human Land Use Data
- Investigation of Resilience Loss in AMSR2’s X-Band
- Results Proving Robustness
- Potential Driving Forces and Sources of Bias
INVESTIGATION OF RESILIENCE LOSS IN AMSR2’S X-BAND
Text S7. The influence of forest loss for the years 2021 to 2022
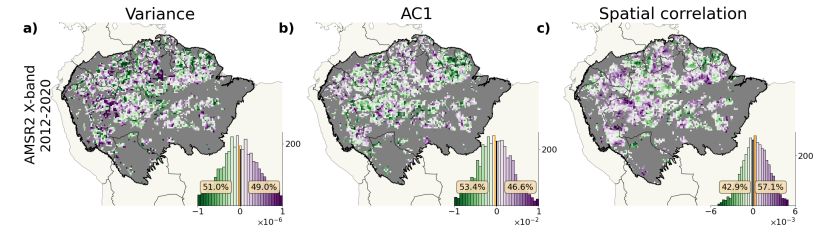
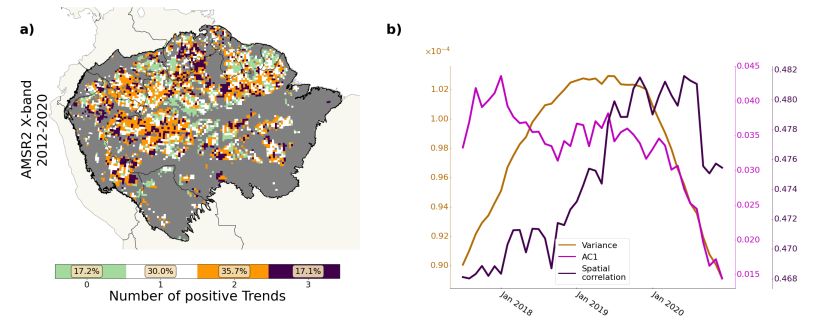
The X-band of AMSR2 results from the observation of a shorter wavelength compared to the two C-bands. This leads to less sensitivity to aboveground biomass, which is why the results are less likely to indicate whether the ARF is loosing resilience or not. For completeness, Figures S7 and S8 show the results for the X-band. While the spatial correlation is more often increasing than not, which is comparable to the results in the C-bands, this is not the case for variance and AC1 (Figure S7). While the percentage of cells in Figure S8a) exhibiting a positive trend in all three indicators is still above what would be expected by random (12.5 %), it is far less than detected for AMSR2’s C-bands.
\
\
What's your thoughts?
Please Register or Login to your account to be able to submit your comment.